
Kubernetes Manager
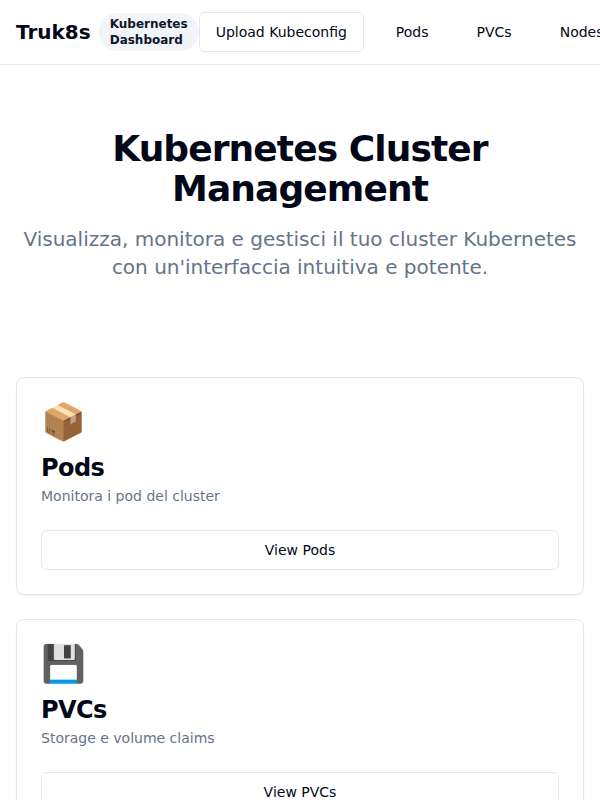
Truk8s — Kubernetes Cluster Dashboard
Point it at a Kubernetes cluster and see what’s running: pods, persistent volume claims and nodes, plus a chat window you can ask about any of them.
Read-only. Truk8s reports on your cluster; it never changes it.
Connecting a cluster
Upload your kubeconfig from the home page. It is validated before anything
else happens — the file must parse as YAML and carry the clusters, users and
contexts sections a real kubeconfig has — and you’re told how many of each it
contains. Invalid files are rejected with the reason.
Valid configs are stored, and the most recently uploaded one is the cluster everything else talks to. Upload another to switch.
Monitoring
Pods, PVCs and nodes each get their own view, reachable individually or together as tabs on one dashboard.
Pods — every pod across all namespaces, with its namespace, phase (Running, Pending, Failed, Succeeded), the node it landed on and its containers. A summary line counts the total and how many are running, and status badges are colour-coded so failures stand out.
PVCs — every claim with its namespace, phase (Bound, Pending, Lost), requested capacity, access modes and bound volume, with a count of how many are bound.
Nodes — every node with its Ready state, its role (control plane or worker), its conditions, and its capacity and allocatable resources, with a count of how many are ready.
Each view reloads on demand, and the pod view can reload with a verbose log showing exactly what it fetched and processed — useful when a cluster isn’t responding as expected.
Some columns in the tables are placeholders showing N/A — pod restarts and age, node CPU, memory and pod counts, PVC usage. The monitoring API doesn’t collect them yet.
Chat
Ask about the cluster in plain language — “how many pods are failing?”, “what’s the node status?”, “show me the deployments”. The question goes to a language model together with a snapshot of the live cluster: every pod, PVC, node and deployment at that moment, so answers are grounded in the real state rather than guessed.
If the model can’t be reached, the chat degrades gracefully instead of failing: it falls back to deterministic keyword answers that still report the real numbers — failing pods by name, nodes ready out of total, counts of PVCs and deployments.
How it is put together
A React and TypeScript single-page app (Vite, Tailwind CSS, shadcn/ui, TanStack Query) over three Python actions on Apache OpenServerless, all using the official Kubernetes client:
| Endpoint | Does |
|---|---|
POST /api/my/v1/upload-kubeconfig | validate a kubeconfig and store it |
GET /api/my/v1/cluster-monitor | pods, PVCs and nodes, with per-status summaries |
POST /api/my/v1/ai-chat | answer a question using a live cluster snapshot |
Kubeconfigs are kept in S3, uploaded under a unique key with the original
filename and cluster/user counts as metadata; the actions load the newest one
into the Kubernetes client in memory. The chat calls an Ollama endpoint,
configured through OLLAMA_URL and OLLAMA_MODEL.